Quanterix Akoya Vectra 3
Quanterix Akoya Vectra 3
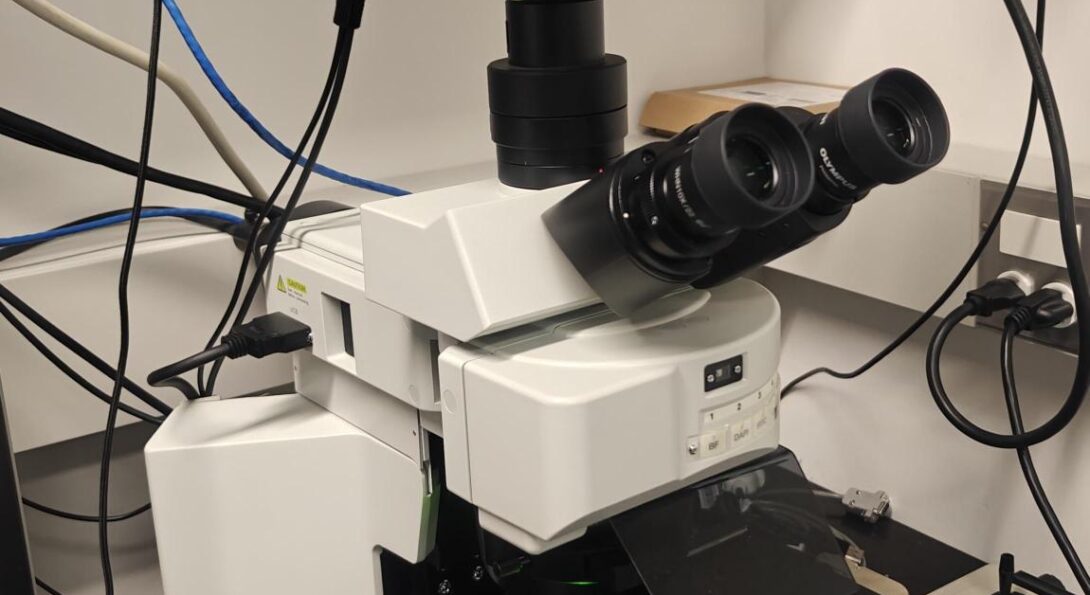
The Akoya Biosciences Vectra 3 (originally developed by CRI, Caliper and PerkinElmer) is an automated quantitative pathology imaging system designed for multispectral analysis of tissue sections and tissue microarrays (TMAs). It functions as a mid-throughput predecessor to the PhenoImager HT platform, focusing on the identification and isolation of overlapping biomarkers.
Core System Specifications
- Optical Magnification: Supports objective lenses for image acquisition at 4x, 10x, 20x and 40x magnification.
- 6-Slide Capacity: Utilizes standard manual stage insert slots for smaller batch runs.
- Imaging Modalities: Acquires standard color brightfield (such as H&E or DAB immunohistochemistry) and multispectral fluorescence images in MSI format.
- Fluorescence Excitation: Uses a mercury arc-lamp light source combined with a core epi-fluorescence filter wheel. Standard configurations utilize five main long-pass filter sets: DAPI, FITC, Cy3, Texas Red, and Cy5 in combination with a liquid crystal tunable filter (LCTF).
- Software Interface: Integrates with Phenochart whole-slide viewer software for slide navigation and annotation. Data is then transferred to inForm software for cell segmentation and tissue classification.
Multispectral Imaging Capabilities
- Spectral Range and Resolution: Captures light emission across a detection spectrum of 420 nm to 720 nm (or 440 nm to 720 nm depending on the internal sensor configuration). The user can select scanning bandwidth steps of either 20 nm or 40 nm.
- Multiplex Panel Capacity: Resolves and isolates up to 10 overlapping optical signals or markers within a single region of interest, including the independent contribution of tissue background autofluorescence.
- Mathematical Unmixing Strategy: Relies on post-acquisition linear unmixing equations. Rather than using hardware filters to fully separate light during the scan, the system captures a series of sequential wavelength images (a multispectral data cube). The inForm software then compares these raw pixels against known pure single-stained reference curves to mathematically separate the markers.
Microscope Images
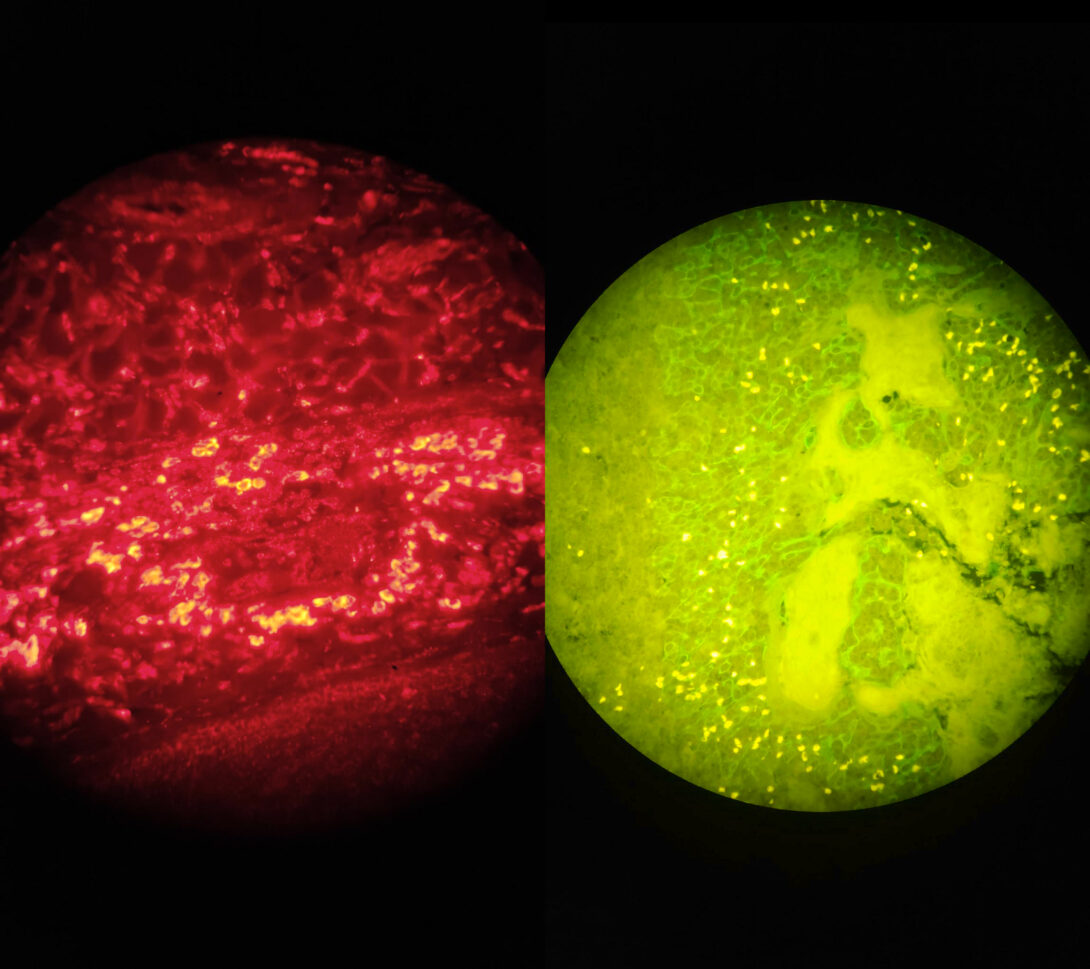
Left: UGGT1 (Opal 620) in human skin. True signal is seen as orange with autofluorescence being red. Right: AE1/AE3 (Alexa 488) in human tonsil. True signal is a pure green while autofluorescence is various hues of yellow. The long-pass filters used make it easy to differentiate true staining from background autofluorescence.