Introduction
The RTIC provides image analysis infrastructure to convert brightfield and fluorescence whole slide images with thousands of cells into quantifiable cellular and sub-cellular data. The facility hosts software platforms including HALO®, QuPath, and inForm® to support deep learning workflows and spatial metrics for research applications.
Deep Learning Classifiers: AI-driven tissue segmentation to automatically isolate tumor nests, stroma, necrotic zones, and healthy tissue.
Spatial Phenotyping: Detailed mapping of the tissue microenvironment, including cell-to-cell distances, proximity analysis, and spatial clustering.
Brightfield Quantification: High-throughput analysis for standard histopathology, chromogenic IHC, and special stains.
Fluorescence & Multiplexing: Precise co-localization, multi-marker phenotyping, and low-abundance target detection.
Automated Object Detection: Rapid, reproducible cell counting and morphometric profiling across whole-slide images.
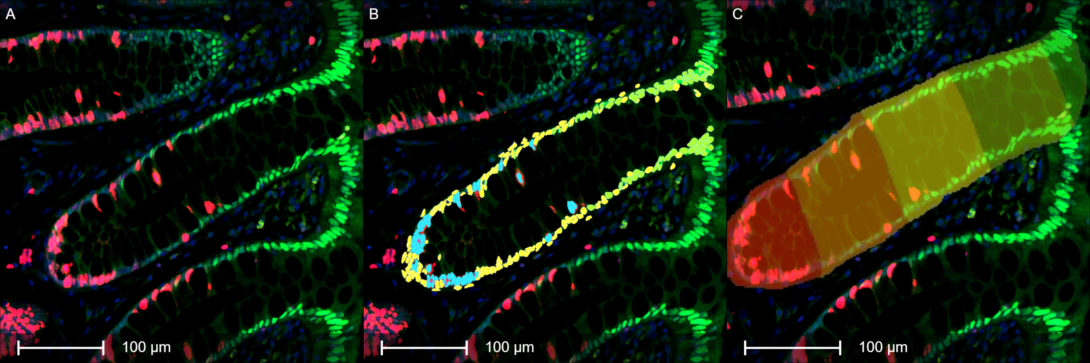
Ki67 and p21 Dual Immunofluorescence in Human Colon
Objective
To quantify cellular proliferation and differentiation markers within the spatial architecture of human colon biopsies using high-resolution digital pathology and automated image analysis.
Methodology
- Digital Scanning: Human colon biopsy slides are digitized at 20x magnification using the Evident VS200 research slide scanner to capture high-resolution brightfield or fluorescence images.
- Manual Annotation: Full, intact colon crypts are manually annotated by expert reviewers to establish the precise anatomical boundaries of the tissue microenvironment.
- Cellular Quantification: Using the HALO® image analysis platform, individual cells within the annotated crypts are segmented and scored for their Ki67 (proliferation) and p21 (differentiation) expression status.
- Spatial Mapping: HALO® is utilized to calculate the exact distance of each segmented cell relative to the manually defined crypt base, enabling position-dependent phenotypic profiling.
Expected Outcomes
This workflow generates a detailed spatial map of cell fate markers along the crypt axis. By correlating Ki67 and p21 expression with exact cellular coordinates, the project reveals insights into the spatial regulation of homeostasis, differentiation, and disease progression in the human intestinal epithelium.
Principal Investigator: Dr. Lisa Tussing-Humphreys
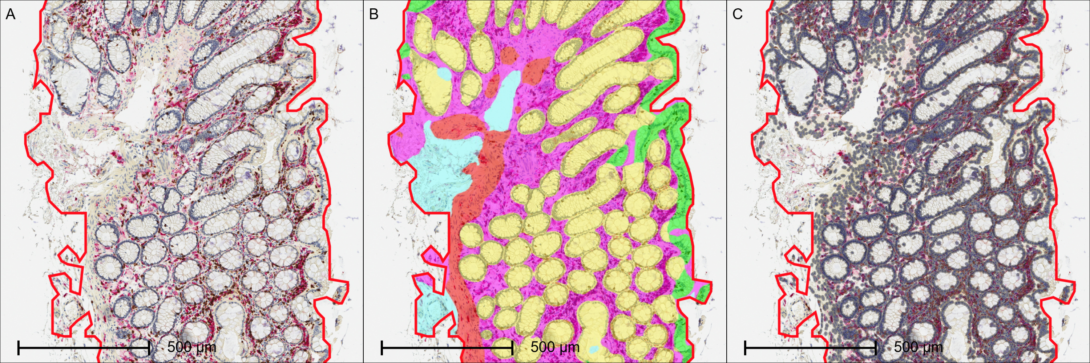
Compartmentalized Immune Profiling of T Cells and Macrophages in Human Colon Biopsies
Objective
To quantify the spatial density and percentage of T cells and M2 macrophages across distinct morphological compartments of human colon tissue using automated tissue segmentation and multiplexed digital pathology.
Methodology
- Digital Scanning: Human colon biopsy immunohistochemistry (IHC) slides, dual-stained for CD3 (T cells) and CD163 (M2-polarized macrophages), are digitized at 20x magnification using the Leica Aperio AT2 Whole Slide Scanner.
- Automated Tissue Segmentation: HALO AI™ deep learning tissue classifiers are utilized to automatically segment the complex colon architecture into four distinct anatomical regions: the lamina propria, muscularis mucosae/propria, epithelium, and intestinal crypts.
- Cellular Quantification: Within each AI-segmented tissue compartment, individual cells are identified to calculate the percent positive cells and positive cell density (cells/mm²) for both CD3 and CD163 biomarkers independently.
Expected Outcomes
This objective workflow eliminates manual tissue delineation bias and maps immune cell infiltration directly to specific functional layers of the colon. By evaluating CD3 and CD163 cell densities within distinct compartments, the project aims to uncover localized immune signatures relevant to chronic inflammation, colorectal oncology, or mucosal healing dynamics.
Principal Investigator: Dr. Lisa Tussing-Humphreys
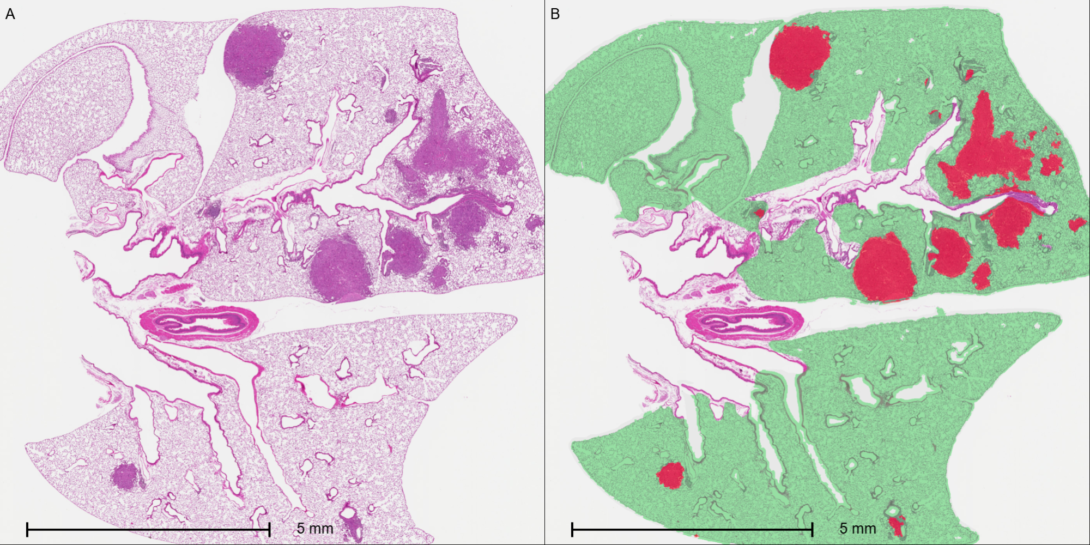
Deep Learning-Based Quantification of Lung Tumor Burden in Mouse Models
Objective
To automatically quantify lung tumor burden in mouse models by utilizing deep learning classifiers to measure tumor area relative to the total lung tissue area.
Methodology
- Digital Scanning: Mouse lung tissue slides stained with Hematoxylin and Eosin (H&E) are digitized to capture high-resolution morphological details.
- Deep Learning Tissue Classification: HALO AI™ deep learning tissue classifiers are trained and deployed to automatically segment and distinguish tumor regions from healthy lung parenchyma and background airspaces.Area
- Calculation & Normalization: The HALO® platform automatically calculates the total surface area (mm 2 ) of the identified tumor nests, as well as the total area of the lung tissue section.
- Tumor Burden Metric: The final tumor burden is expressed mathematically as a percentage of the total lung tissue area ([Tumor Area/Total Tissue Area]*100).
Expected Outcomes
This workflow provides a highly reproducible, unbiased, and high-throughput method for evaluating tumor progression or treatment efficacy in preclinical mouse models. By automating tissue segmentation, this approach eliminates the variability of manual area estimation and delivers precise volumetric-proxy data for oncology research.
Principal Investigator: Dr. Gye Young Park
mir199 Expression in Histologically Normal Prostate and Prostate Tumors
Objective
To investigate the spatial expression patterns of miR-199 within the stroma of a prostate tissue microarray (TMA), testing the hypothesis that miR-199 expression is elevated in stroma adjacent to benign glands and reduced in stroma surrounding malignant glands.
Methodology
- Assay & Digital Scanning: RNAscope® chromogenic in situ hybridization is performed on prostate TMA sections to visualize miR-199 transcripts. Stained slides are digitized at 40x magnification using an Evident VS200 slide scanner to capture high-resolution single-molecule signals.
- TMA & Tissue Segmentation: High-resolution core images are managed and de-arrayed within the Indica Labs HALO® platform using the TMA Module. A HALO AI™ tissue classifier is deployed to automatically segment the cores into glandular epithelial structures and surrounding stromal compartments.
- Proximity Masking & Region Refinement: Advanced region drawing and proximity tools are utilized to generate a strict 20 um spatial buffer zone extending outward from the margins of the segmented glands, restricting downstream analysis exclusively to the immediate peri-glandular stroma.
- Signal Quantification: The HALO® FISH (Fluorescence/Chromogenic In Situ Hybridization) module is applied within the 20 um stromal boundaries to automatically detect, count, and measure individual miR-199 expression spots.
- Expression Metric: The spatial expression profile of miR-199 is evaluated by comparing the spot density or signal intensity in the 20 um peri-glandular stroma of normal glands versus cancer glands.
Expected Outcomes
This automated spatial workflow establishes a high-throughput, objective method for evaluating microRNA localization within complex tumor microenvironments. By precisely mapping and quantifying expression within strict spatial boundaries, this approach clarifies the localized paracrine or stromal-epithelial interactions of miR-199 in prostate cancer progression.
Principal Investigator: Dr. Larisa Nonn
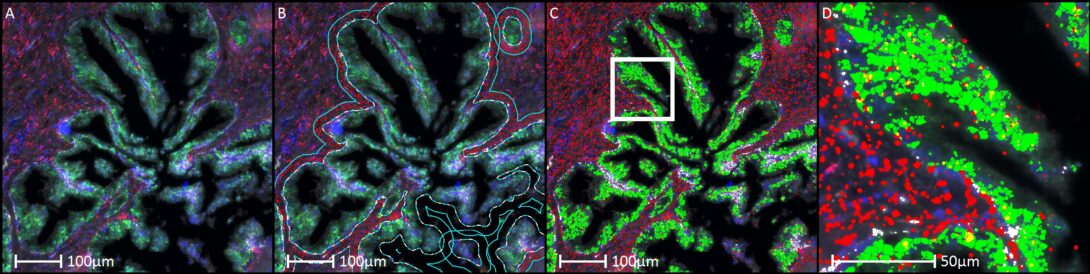
Immune cell phenotyping in 7-Color Opal mIF
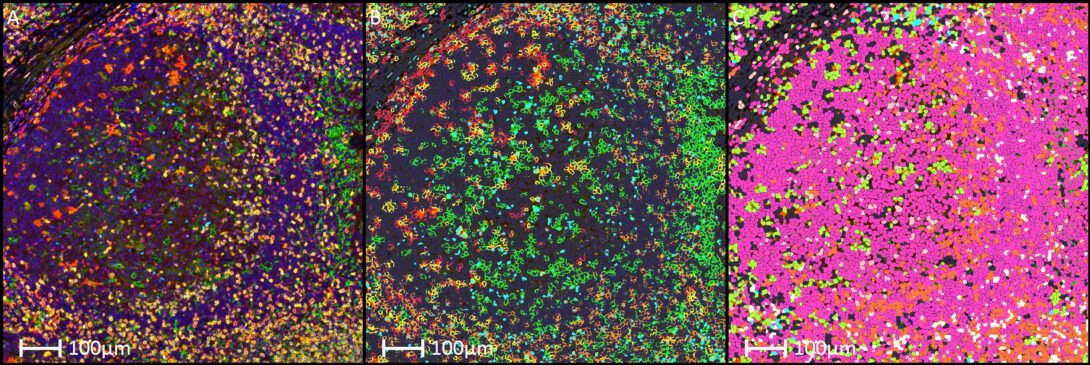
Objective
To perform comprehensive spatial immune cell phenotyping within human tonsil tissue by leveraging multiplex immunofluorescence (mIF) and automated single-cell analysis to map lymphoid and myeloid cell subpopulations.
Methodology
- Multiplex Staining & Imaging: Human tonsil sections are stained using a multiplex panel including Dapi (nuclear counterstain), CD3, CD4, CD8 (T-cell lineages), GATA3 (transcription factor), FoxP3 (regulatory T-cells), CD163 (M2 macrophages), and TRBC1 (T-cell receptor beta constant 1 for clonality tracking) to capture high-resolution spatial proteomic data.
- Single-Cell Segmentation: Digitized multiplex images are imported into the analytic platform, where Dapi nuclear staining is used to drive precise single-cell segmentation algorithms, establishing distinct cellular boundaries for downstream marker intensity evaluation.
- Phenotypic Gating & Classification: Machine learning classifiers and multi-channel intensity gating are applied to automatically identify and categorize complex immune subsets, such as helper T-cells (CD3+CD4+), cytotoxic T-cells (CD3+CD8+), regulatory T-cells (CD3+CD4+FoxP3+), Th2-skewed cells (CD3+CD4+GATA3+), TRBC1+T-lymphocytes, and polarized macrophages (CD163+).
- Spatial Quantification Metric: The composition of the immune microenvironment is calculated by determining the absolute counts, spatial density (cells/mm2), and relative percentages of each highly defined immune phenotype across different functional compartments (e.g., germinal centers, mantle zones, and interfollicular regions) of the tonsil.
Expected Outcomes
This advanced multiplex phenotyping workflow provides a highly reproducible, objective, and high-throughput framework for dissecting the cellular architecture of human lymphoid tissues. By resolving overlapping cellular markers at single-cell resolution, this approach enables a deeper understanding of spatial immune networks, cellular polarization, and T-cell receptor distributions in human immunology research.
Principal Investigator: Dr. Carlos Murga-Zamalloa