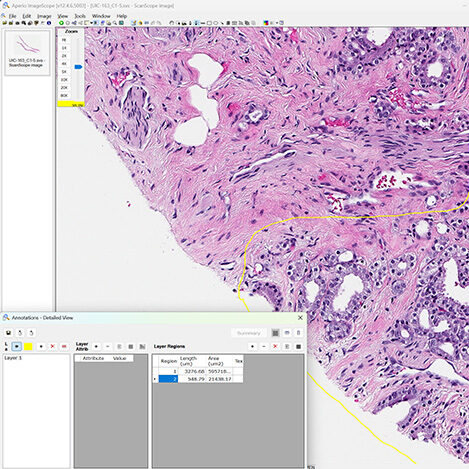
Leica Aperio ImageScope
Image Scope is a specialized digital pathology desktop viewer designed to navigate and analyze massive, gigapixel whole slide images (WSIs), primarily in the native .svs format. The software provides seamless panning, fluid zooming, and side-by-side slide comparison tools to evaluate different tissue stains simultaneously. It features a robust annotation suite—including digital rulers, shape drawing, and cell counters—that saves data into external XML files without altering the original image. These annotations can be read into other image analysis packages such as Indica Labs Halo.
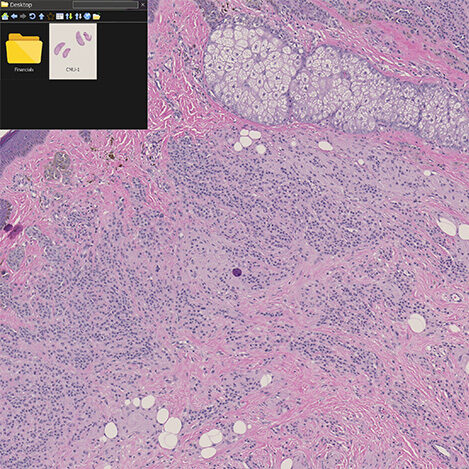
Hamamatsu Nanozoomer NDP.View2
NDP.view2 is a free, high-performance viewing software designed to navigate and analyze massive, gigapixel digital whole slide images captured by Hamamatsu NanoZoomer scanners (.ndpi files). The platform functions like a digital microscope, utilizing advanced caching to deliver fluid, lag-free panning and zooming across large tissue samples. Key functional features include multi-slide synchronization for side-by-side specimen comparisons, 360-degree image rotation for optimized viewing orientation, and Z-stack adjustment to change the focal depth of multi-layered tissue scans. Additionally, users can leverage built-in annotation and measurement tools to draw shapes, add text notes, and calculate exact distances or surface areas directly on the slide.
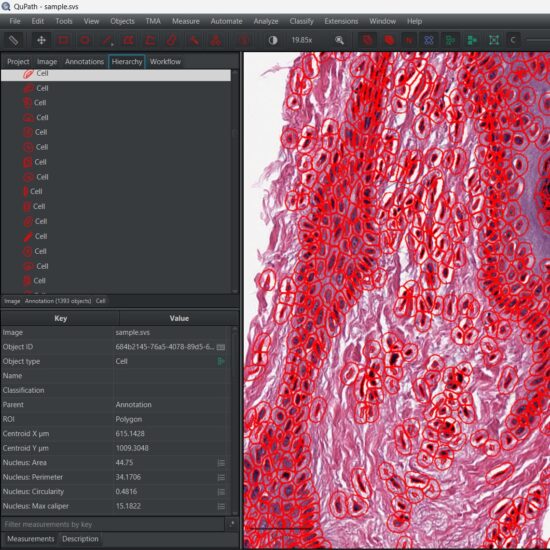
QuPath
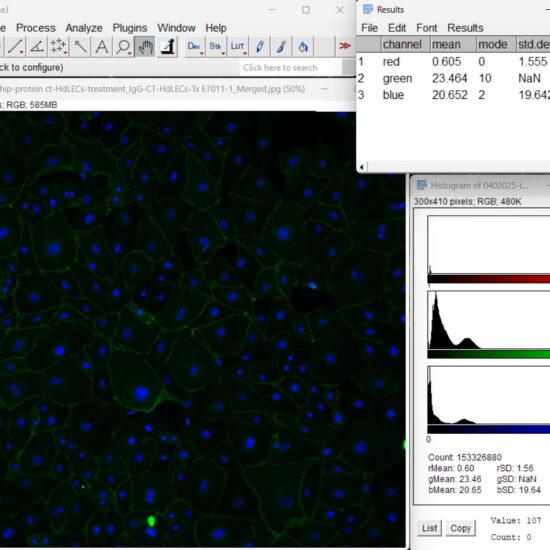
FIJI (Fiji Is Just ImageJ)
Fiji is an open-source image processing package bundled with a variety of plugins designed for scientific image analysis. It is a distribution of ImageJ that automatically includes a software updater, a menu structure, and extensive documentation to streamline scientific workflows. The platform handles multidimensional image data, including 3D time-lapse sequences, and supports multiple file formats through the integrated Bio-Formats plugin. It features built-in tools for image registration, segmentation, tracking, and 3D visualization, while allowing users to automate tasks using macros and various scripting languages.
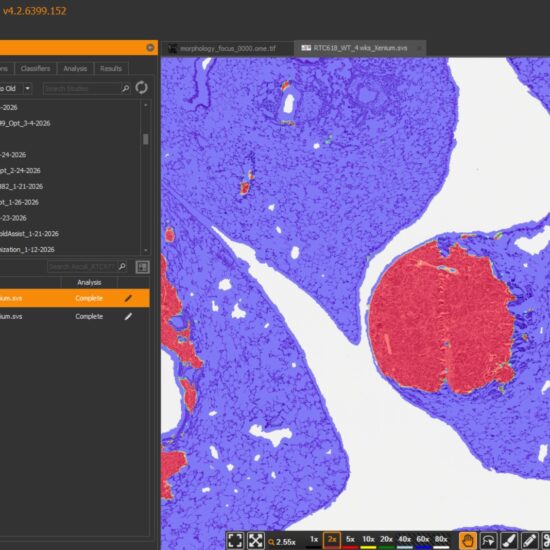
Indica Labs Halo
HALO is a proprietary, quantitative tissue analysis platform designed specifically for digital pathology and whole-slide images. It features a modular architecture with pre-built application modules for immunohistochemistry, fluorescence, and multiplexed assays like RNAscope and FISH. The platform includes HALO AI, a deep learning module for tissue classification, tumor segmentation, and cell phenotyping. Functionally, the software generates cell-by-cell morphological and expression data across entire tissue sections while maintaining an interactive link between individual cell statistics and the corresponding coordinates on the source image. Additional features include real-time parameter tuning, heatmaps for spatial analysis, multi-slide image registration, and cloud or multi-node network deployment models.
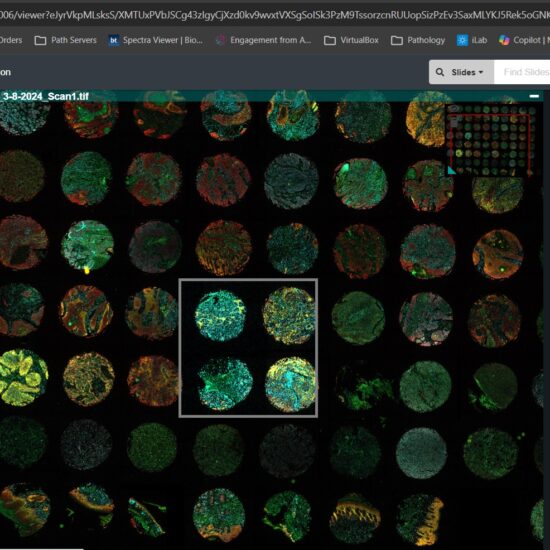
Indica Labs Halo Link
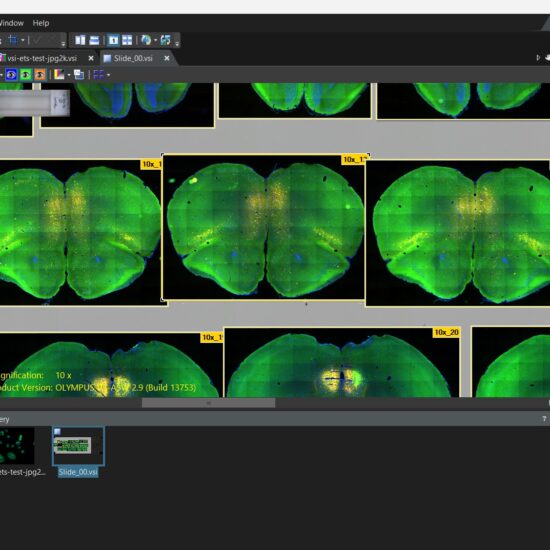
Evident Olympus OlyVIA
Evident OlyVIA is a digital slide viewer software platform designed for reviewing and navigating whole-slide images from research slide scanners. The application reads .VSI and multi-TIFF files, allowing users to view macro overviews and zoom down to individual cellular details. The interface includes tools for manual annotation, side-by-side slide comparisons, histogram adjustments, and channel-by-channel fluorescence visualization. It operates as a Windows desktop application or connects to a Net Image Server (NIS) for browser-based data sharing and multi-user collaboration.
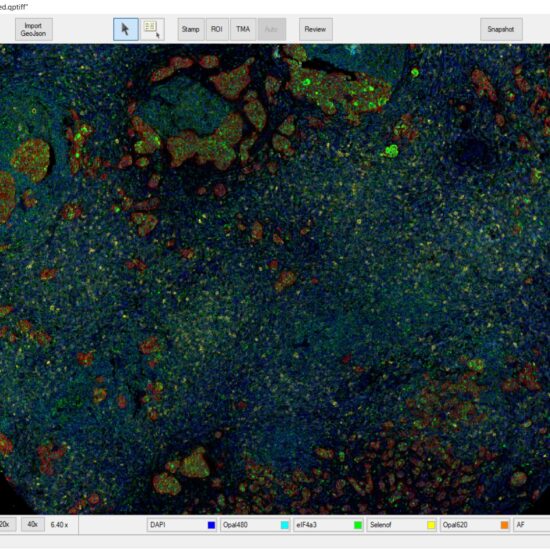
Quanterix Akoya Phenochart/inForm/phenoptrReports
Akoya Biosciences’ multiplex pathology workflow integrates Phenochart, inForm, and phenoptrReports to guide researchers seamlessly from raw tissue scans to structured spatial data. Phenochart acts as the initial whole-slide digital viewer and annotation tool, enabling users to navigate large multiplex slides and manually mark specific Regions of Interest (ROIs) for analysis. inForm then processes these selected regions using trainable machine learning algorithms for tissue and cell segmentation, while utilizing spectral unmixing to isolate overlapping biomarker signals from tissue autofluorescence. Finally, phenoptrReports consolidates these single-cell datasets via an R-based graphical interface, calculating spatial metrics like cell-to-cell distances and generating the final statistical charts and study summaries.